| Disease Name | Number of Genes |
|---|---|
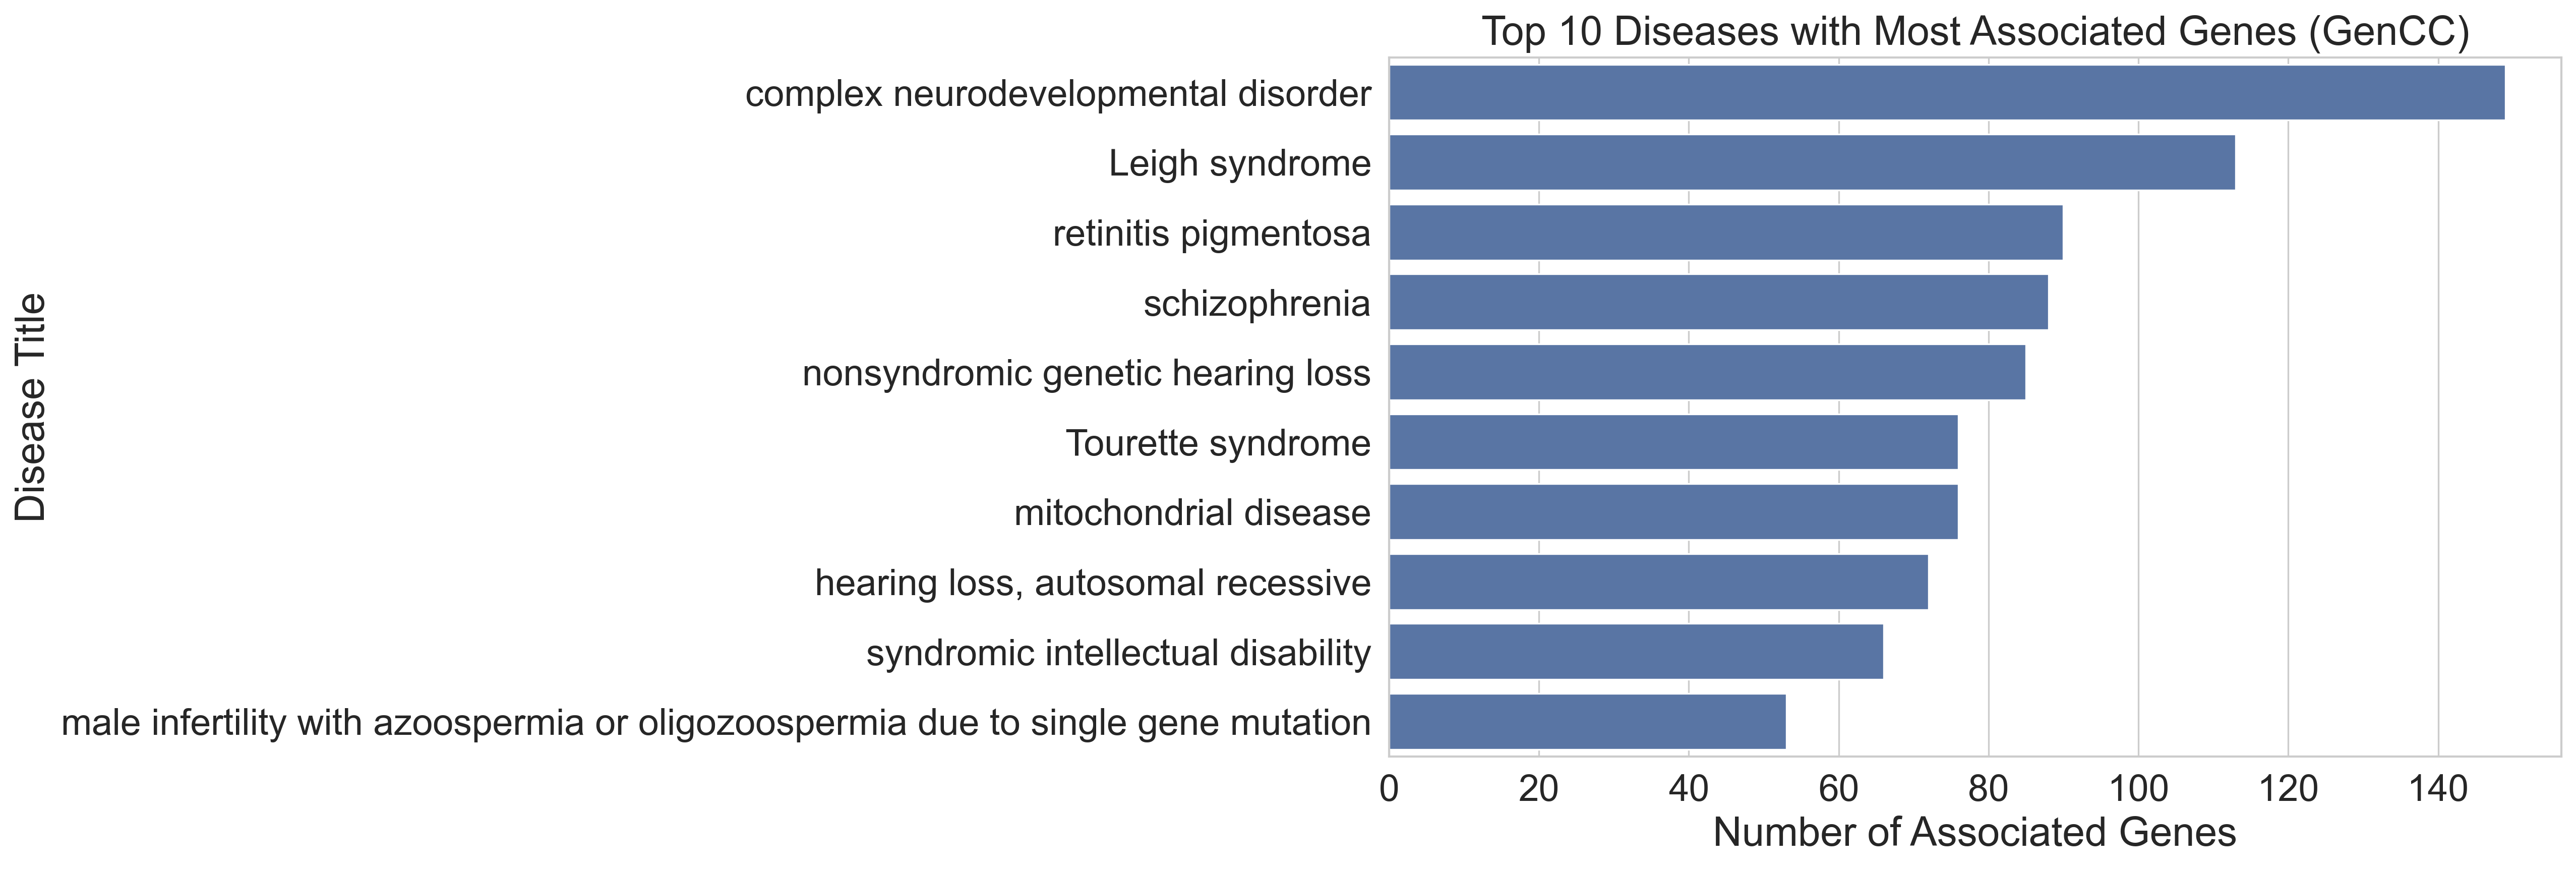
| complex neurodevelopmental disorder | 149 |
| Leigh syndrome | 113 |
| retinitis pigmentosa | 90 |
| schizophrenia | 88 |
| nonsyndromic genetic hearing loss | 85 |
| Tourette syndrome | 76 |
| mitochondrial disease | 76 |
| hearing loss, autosomal recessive | 72 |
| syndromic intellectual disability | 66 |
| male infertility with azoospermia or oligozoospermia due to single gene mutation | 53 |
Gene Curation Coalition Gene-Disease Mappings
1 Gene Curation Coalition Gene-Disease Mappings
2 Introduction
This project explores the GenCC database of gene-disease mappings [1]. The data contains information relating to the validity of gene-disease relationships, focusing on Mendelian diseases. The analyses carried out are intended to provide a general overview of the data, and to identify interesting patterns and trends in the data by consulting the Human Phenotype Ontology [2] and the MONDO disease ontology [3]. Specifically, we are interested in neural and digestive system disorders, how we can use the data to infer and compare the genetic basis of these disorders, and how related subclassed diseases are linked to each other.
3 Data and Methods
The project is divided into four parts. An overview and references of used data and tools is provided in Table 9 and Table 10, respectively. Detailed methodology is provided along the results where appropriate.
First (P1), we conduct a summary analysis of the GenCC data. We first check the data for duplicates and suspicious entries, and then examine gene-disease mapping statistics using the Pandas library for data analysis and the Seaborn and Matplotlib libraries for data visualisation. Using similar methods, we then investigate the confidence categories of the data, and the URLs provided as supporting assertion criteria to gauge the overall validity of the data. Finally, we plot a timeline of the number of submissions over time to identify any trends.
Second (P2), we investigate the Modes of Inheritance (MOI) of the diseases in the GenCC data. We use the Human Phenotype Ontology to obtain the MOI metadata, and then plot the number of unqiue genes in the GenCC data associated with each MOI. The Pronto library is used to work with the ontology data.
For the third part (P3), we use the MONDO disease ontology to select a subset of diseases from the GenCC data, and then plot the number of unique genes associated with each disease. We compare the number of genes associated with the diseases relating to nervous system disorder (NSD) and digestive system disorder (DSD). This is achieved by joining the GenCC with the MONDO disease ontology data. We also examine subclasses of these disorders (the Pronto library is again used for ontology analysis).
Finally (P4), we build a network of NSD diseases and their associated genes, and identify communities of diseases with shared genes. This is achieved using the NetworkX library for network analysis and the netgraph library for data visualisation, a library which builds on top of the NetworkX visualisation tools but provides further functionality to plot clustered networks. The clustering is performed using the algorithms.community.greedy_modularity_communities1 NetworkX function with its default parameters, which uses the Clauset-Newman-Moore greedy modularity maximisation algorithm [4].
For reproducibility purposes we use Quarto, a scientific document authoring tool, to generate this report. All tabular and visual results presented in this report require all Python scripts to compile successfully before the report can be generated. Furthermore, we used a Python dependency management tool, Poetry, to manage the project dependencies and to document specific versions of the libraries used in this project (Listing 1). Lastly, we provide a zip-file of any data used for this project as these datasets are regularly updated and might not be available in the same form in the future. This compressed folder also contains all generated csv-files, tables, and plots used for this report, as well as a pickle-file of the network generated in P4.
3.1 High-Level Description of the GenCC Data
The GenCC data is provided as a tab-separated values (TSV) file, with 18504 rows and 30 columns. An overview of columns relevant for this project is provided in Table 12, Table 13.
3.1.1 Sanity Check
Before exploring gene-disease-mapping statistics, we first conducted a sanity check of the data. There are two entries with the same Unique Universal ID (UUID) (see Table 11 (1)). They are largely identical, except for the differences listed in Table 14. Due to one of the rows containing the submitter name but the other row containing the Mode of Inheritance (MOI) name and the submission classification, we decided to keep both rows, knowing that it will not affect the significance of any of our analyses. Another approach would be to merge the entries but we decided against this approach because we wanted to keep the original data as is, and there is a small change that the UUID for the second entry was generated incorrectly.
To achieve Figure 4, we corrected the submission_as_date field of three entries, one of which specified the year 3016 (Table 11 (2)) (i.e. a likely typo; corrected to 2016), and an alleged submission entry from 1930 (Table 11 (3)) which we removed. The last entry (Table 11 (4)) dates back to 2011 but the supporting assertion criteria URL explicitly references a document released in 2022. This and the fact that it would have been the only pre-2015 entry along with the 1930 entry was justification enough for us to also remove this entry.
4 Results
4.1 Part One – Summary Analysis of GenCC Data
4.1.1 Gene-Disease Mapping Statistics
The GenCC data contains 4888 unique genes and 6370 unique diseases. The number of genes associated with an individual disease ranges from 1 to 149. The top 10 diseases with the most number of associated genes are provided in Table 1 and Figure 1. The disease with most associated genes is complex neurodevelopmental disorder (149 genes), followed by Leigh syndrome (113), and retinitis pigmentosa (90).
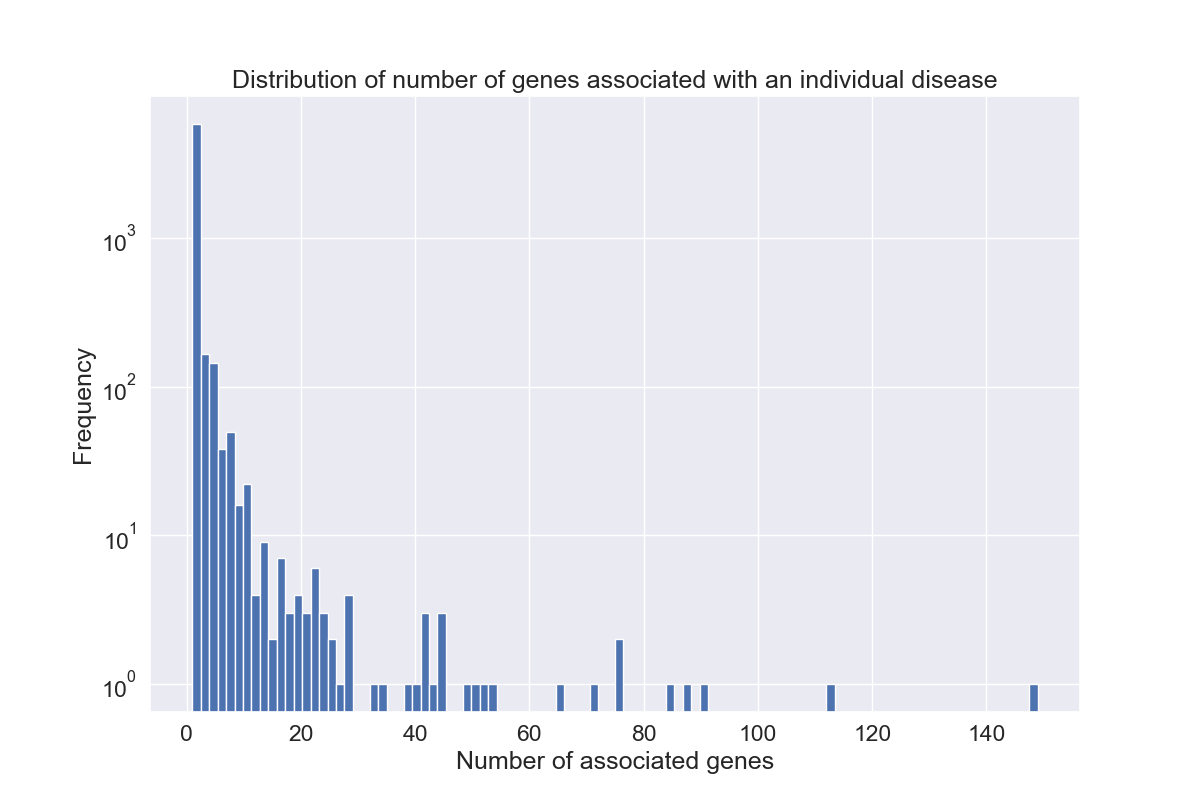
The overall distribution of the number of genes associated with a disease is heavily skewed toward the left (Figure 2), showing that few gene associations per disease are the norm in this data (median: 1.0, std-dev: 4.47, see Table 15).
4.1.2 Evidence Confidence Categories
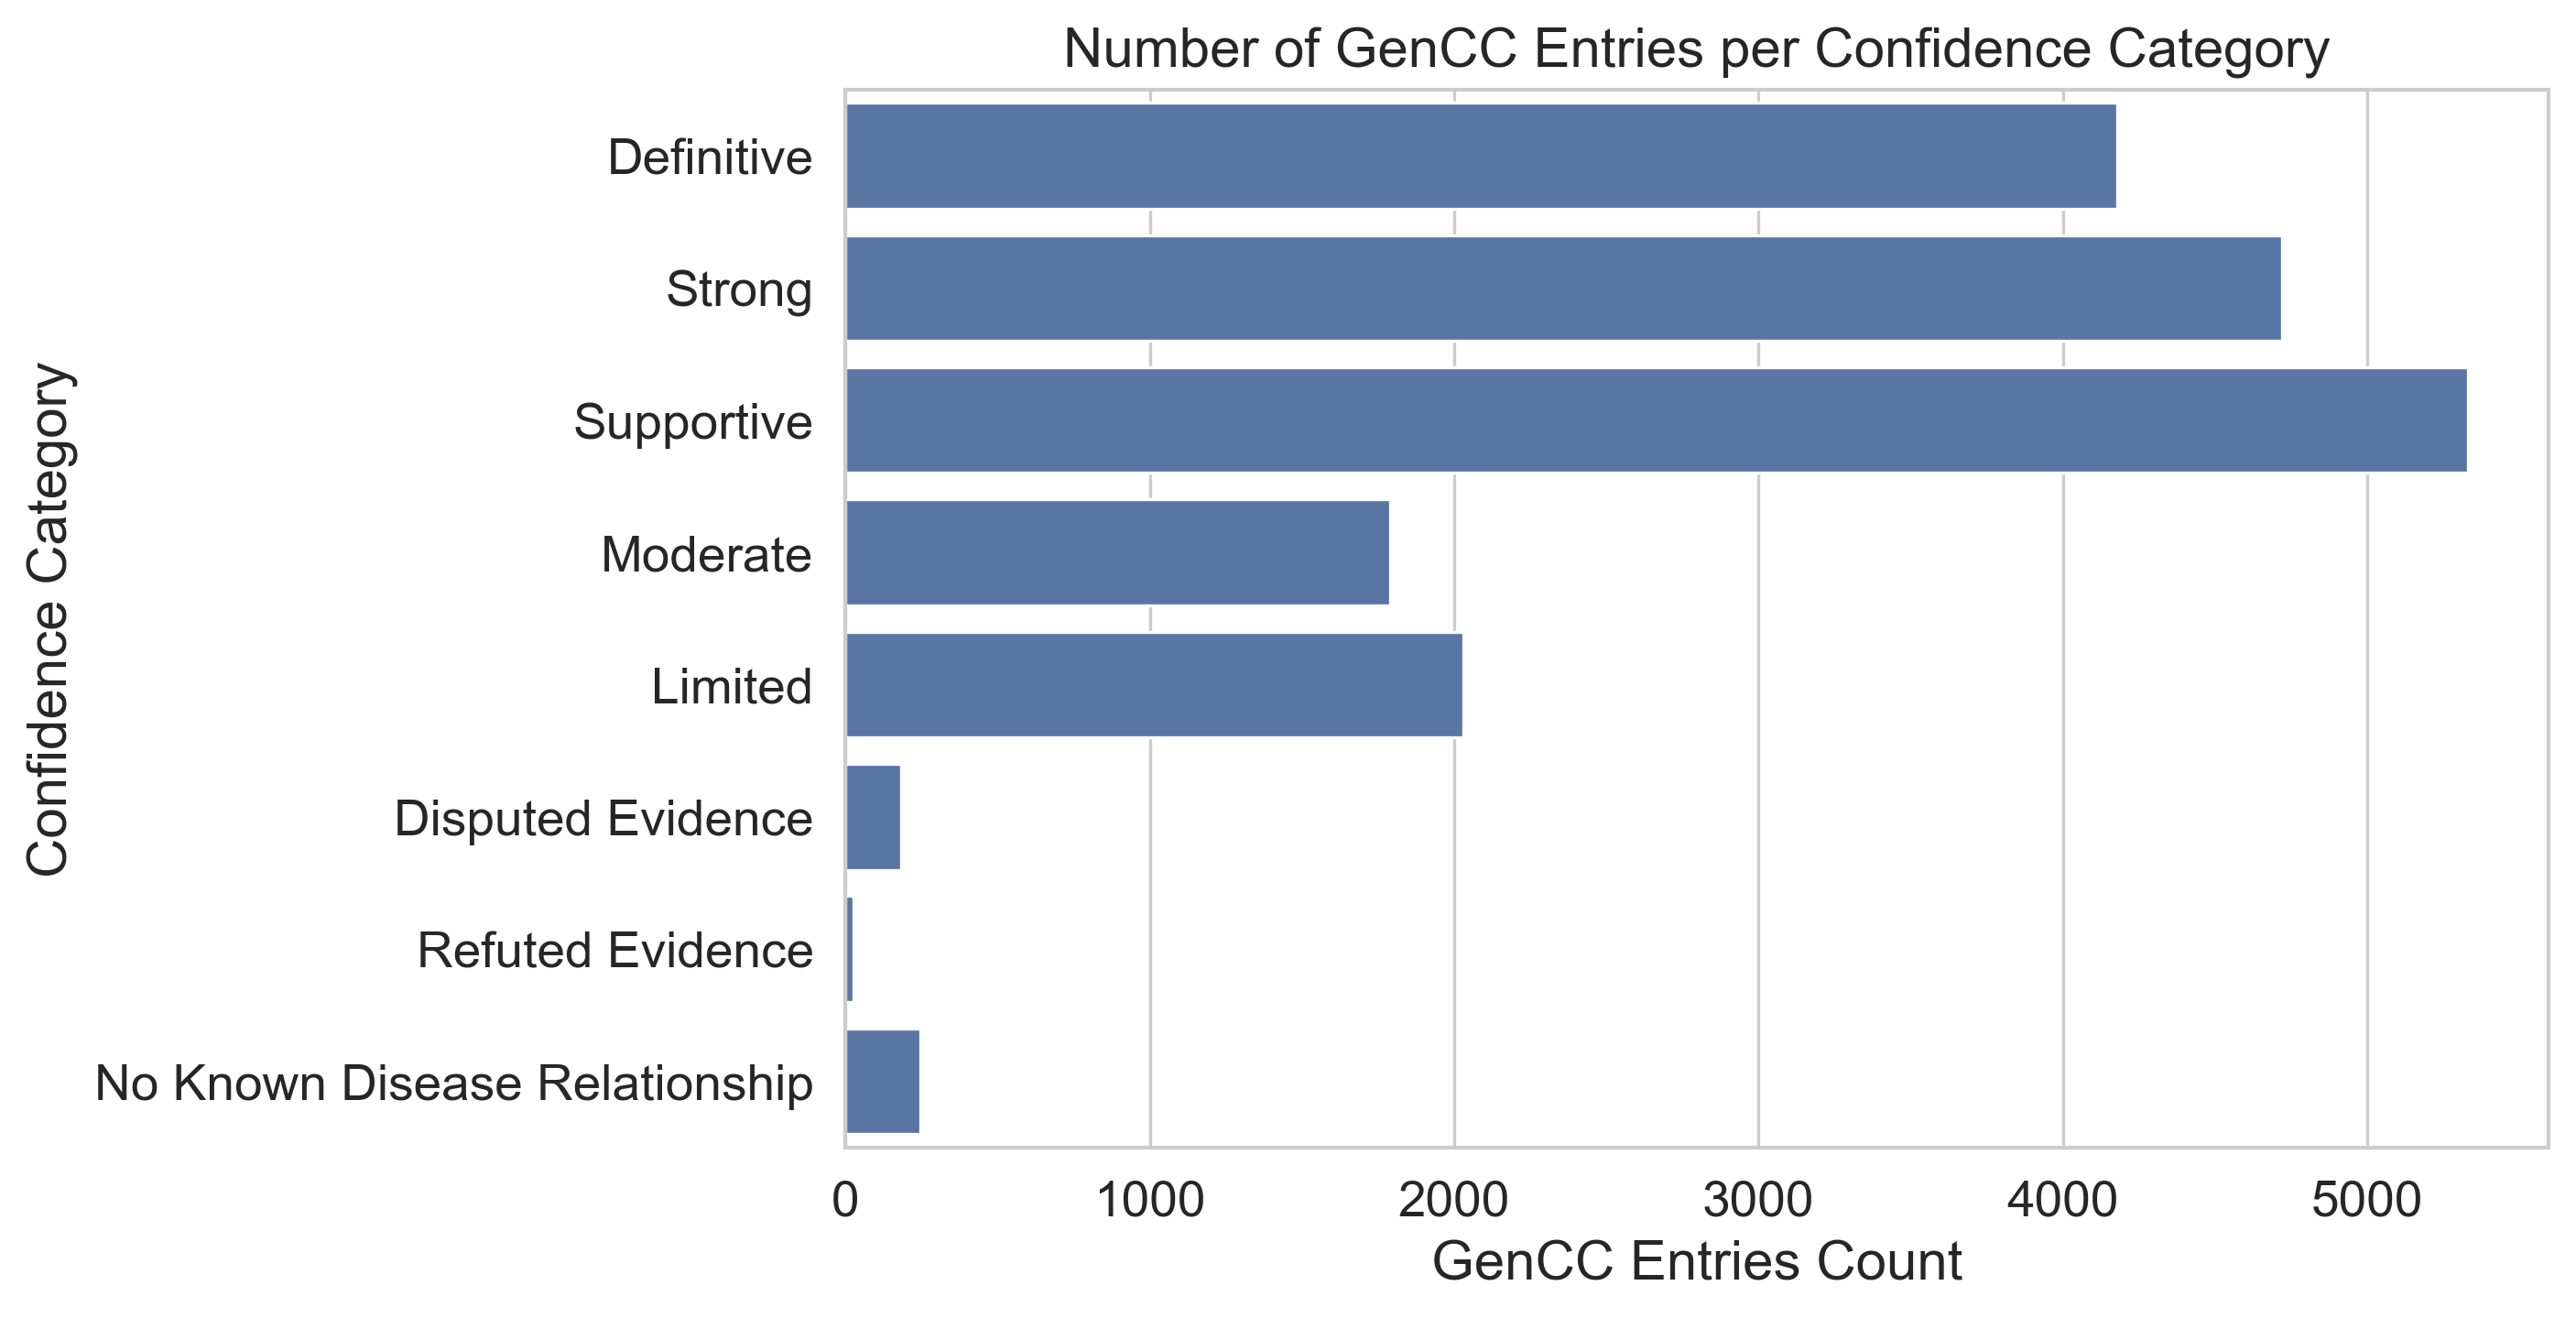
The GenCC data contains 8 confidence categories which indicate the level of evidence supporting the validity of a data entry, shown in Table 2 and Figure 3. The barchart shows that most entries fall into either the definite, strong, or supportive category, with the latter registering the most entries (5330). The fewest entries have refuted or disputed evidence, potentially because such entries might be removed from the data by the Gene Coalition as soon as they are identified to be invalid.
| Confidence Category | GenCC Entries Count |
|---|---|
| Definitive | 4178 |
| Strong | 4720 |
| Supportive | 5330 |
| Moderate | 1791 |
| Limited | 2030 |
| Disputed Evidence | 182 |
| Refuted Evidence | 27 |
| No Known Disease Relationship | 246 |
4.1.3 Supporting Assertion Criteria URLs
The GenCC data has a column submitted_as_assertion_criteria_url to provide provenance information to support the entry. We investigated this considering two standardised resource identifiers: PubMedID (PMID) and Digital Object Identifier (DOI) (Table 3).2
Most fields in this column provide a URL outwith the PMID or DOI categories (Other). This does not mean that the URL does not link to a valid resource. In a more open-ended project, we would investigate the URLs that fall into the Other category further.
| PMID | DOI | Other | NaN |
|---|---|---|---|
| 2507 | 533 | 14216 | 1248 |
4.1.4 Timeline of Submission Counts
The GenCC data also provides the date of submission entries (submitted_as_date column). We can use this data to plot a timeline of the number of submissions over time (Figure 4).
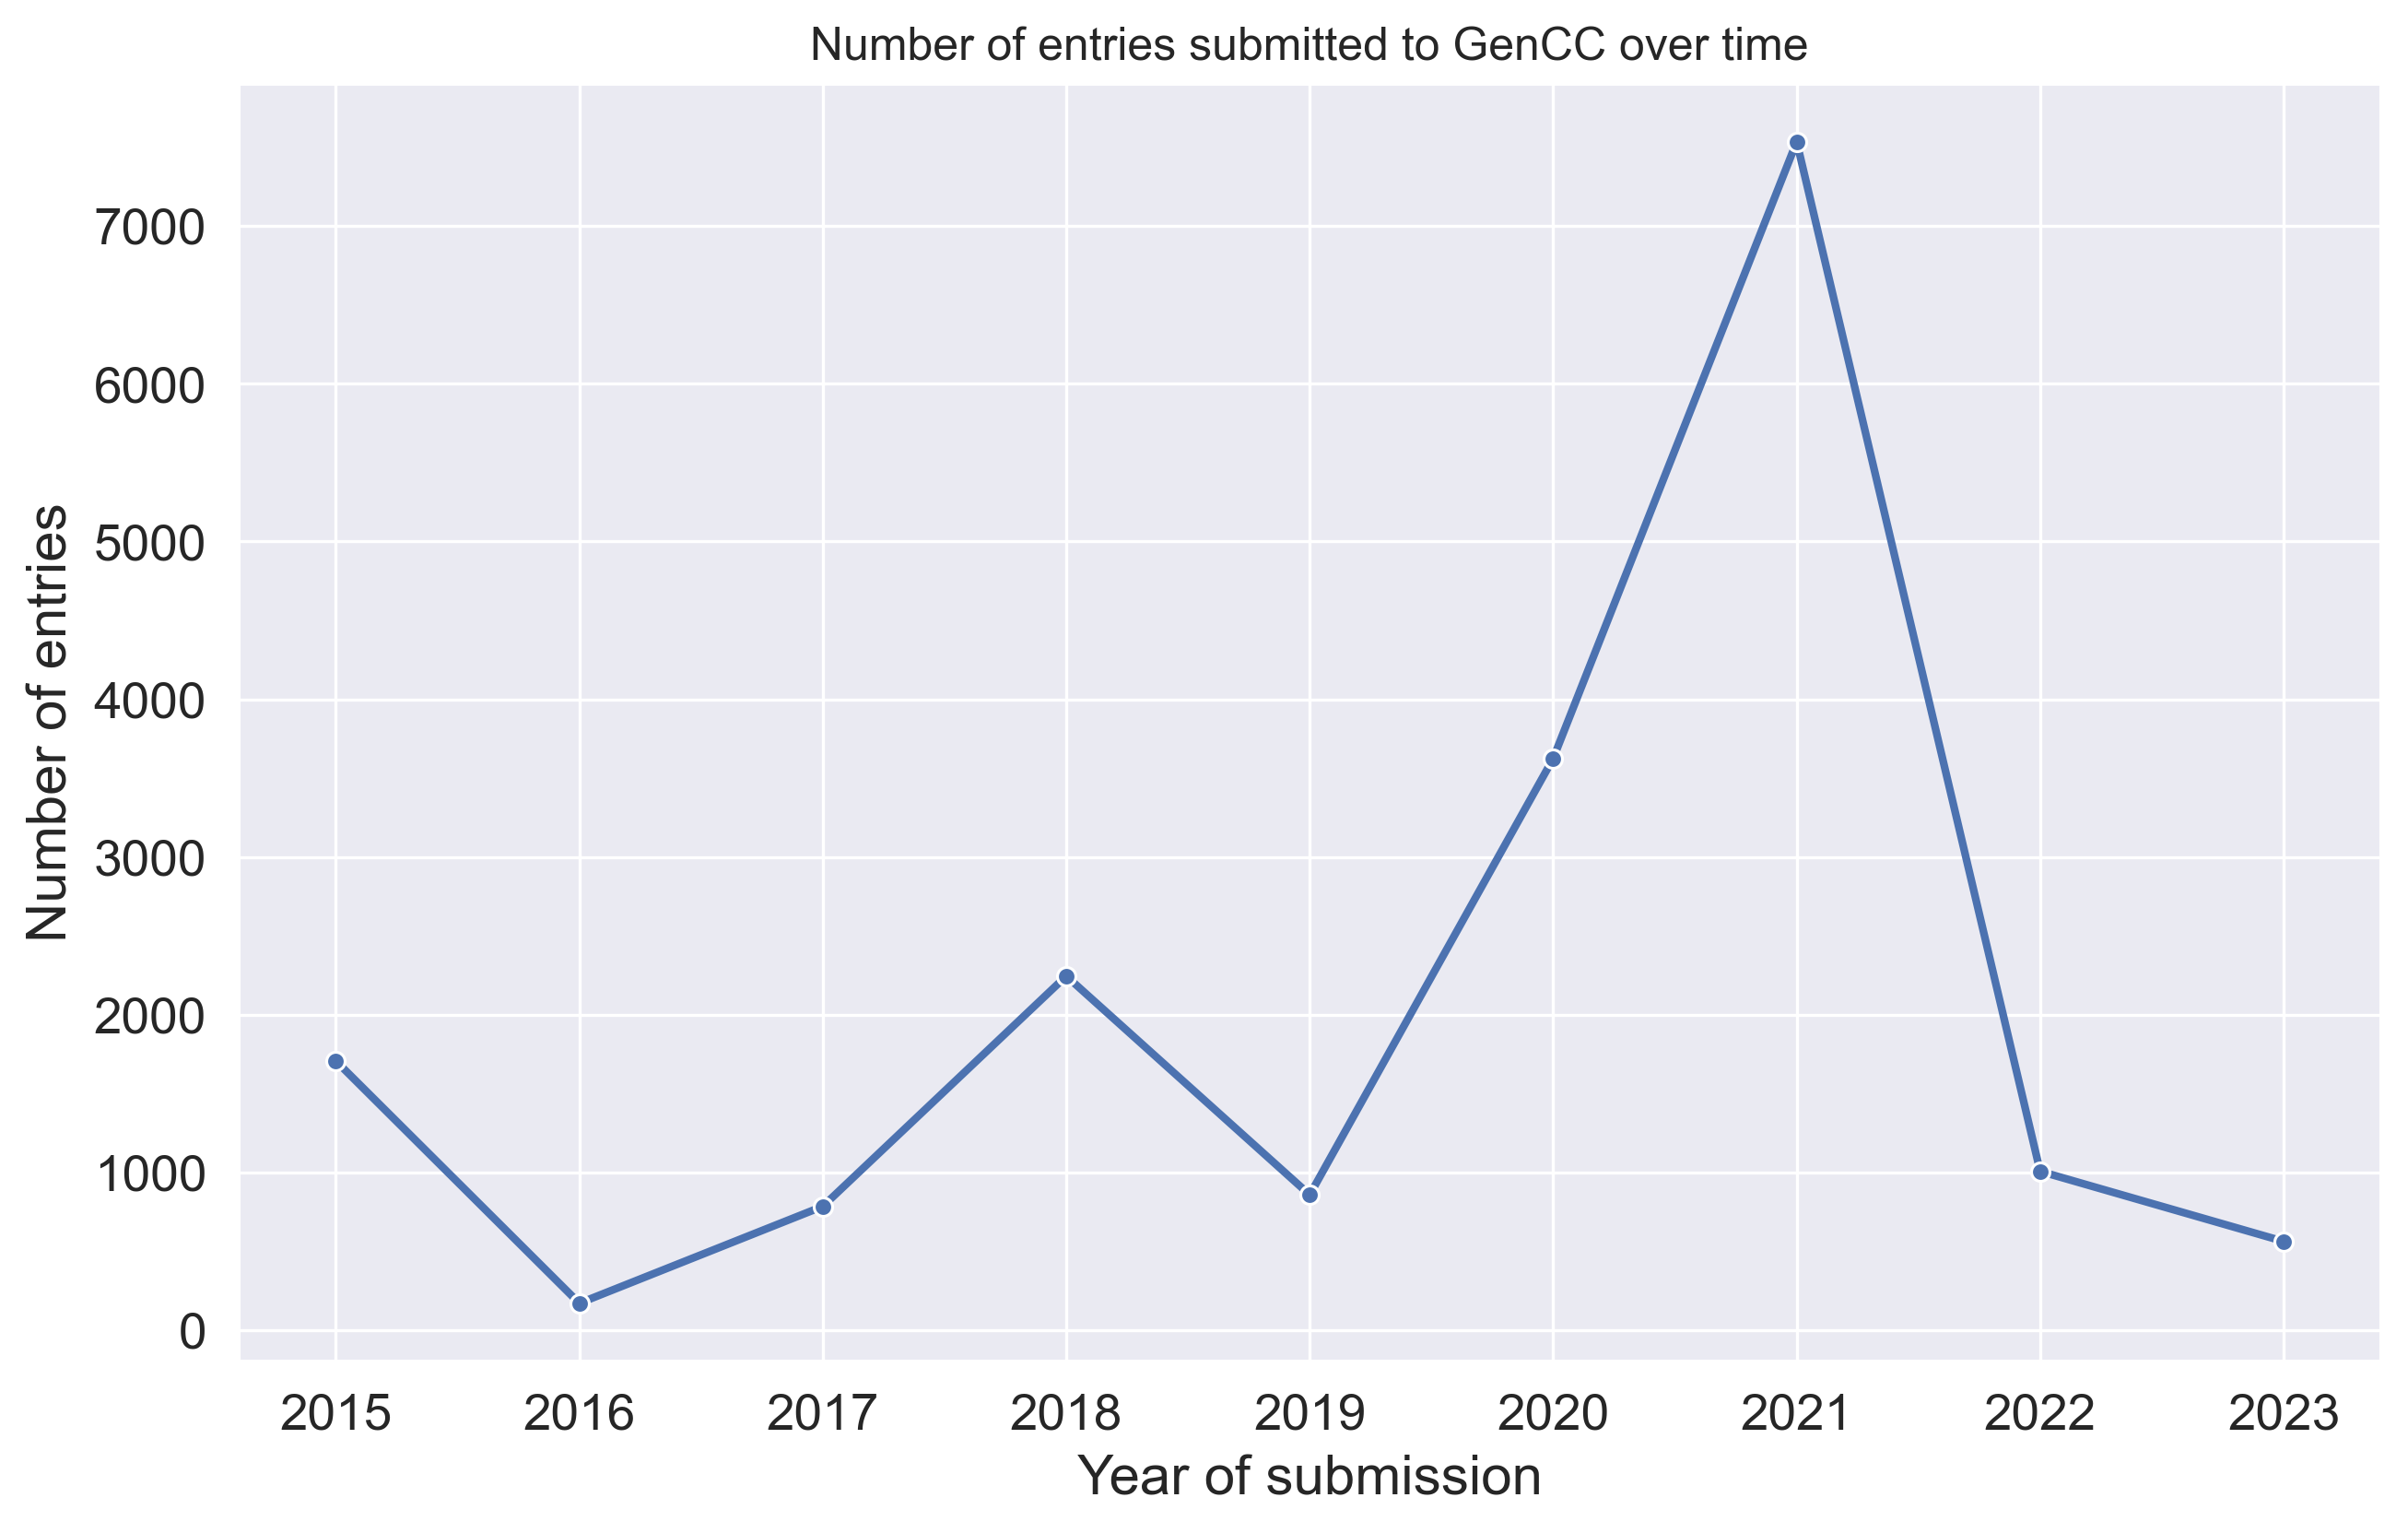
The plot shows that the number of submissions per year is commonly in the range of roughly 50 to 2200 submissions. Two notable exceptions are the years 2020 (3625 submisions) and 2021 (7534 submissions). We identified that the extreme spike for 2021 is caused by Orphanet submitting their rare disease gene evidence data in one go [5]. The trend in 2020 could be explained by the official launch of the GenCC database happening in that year [6].
4.2 Part Two – Modes of Inheritance
Errata:
- The number of genes per mode of inheritance is miscounted, likely an error with filtering for unique genes (Figure 5).
- The interpretation of the distribution is incorrect: autosomal means all chromosomes whereas X and y are single with X being larger than y.
Mode of Inheritance (MOI) is a classification of the way in which a genetic condition is inherited [7]. The GenCC data comprises 18504 entries of which 100% have a MOI Compact URI specified in the corresponding moi_curie column. 329 entries (%) have the placeholder MOI “HP:0000005”, “mode of inheritance”, which describes an unknown or unspecified MOI.
Joining this data with the human phonotype ontology (Table 10), we can obtain the corresponding MOI metadata (Table 4).
| MOI CURIE | Name |
|---|---|
| HP:0000005 | Mode of inheritance |
| HP:0000006 | Autosomal dominant inheritance |
| HP:0000007 | Autosomal recessive inheritance |
| HP:0001417 | X-linked inheritance |
| HP:0001419 | X-linked recessive inheritance |
| HP:0001423 | X-linked dominant inheritance |
| HP:0001427 | Mitochondrial inheritance |
| HP:0001442 | Typified by somatic mosaicism |
| HP:0001450 | Y-linked inheritance |
| HP:0010984 | Digenic inheritance |
| HP:0012274 | Autosomal dominant inheritance with paternal imprinting |
| HP:0012275 | Autosomal dominant inheritance with maternal imprinting |
| HP:0032113 | Semidominant inheritance |
Merging the data from Table 4 with the GenCC data, we can investigate how many unique genes are associated with each MOI (Figure 5).
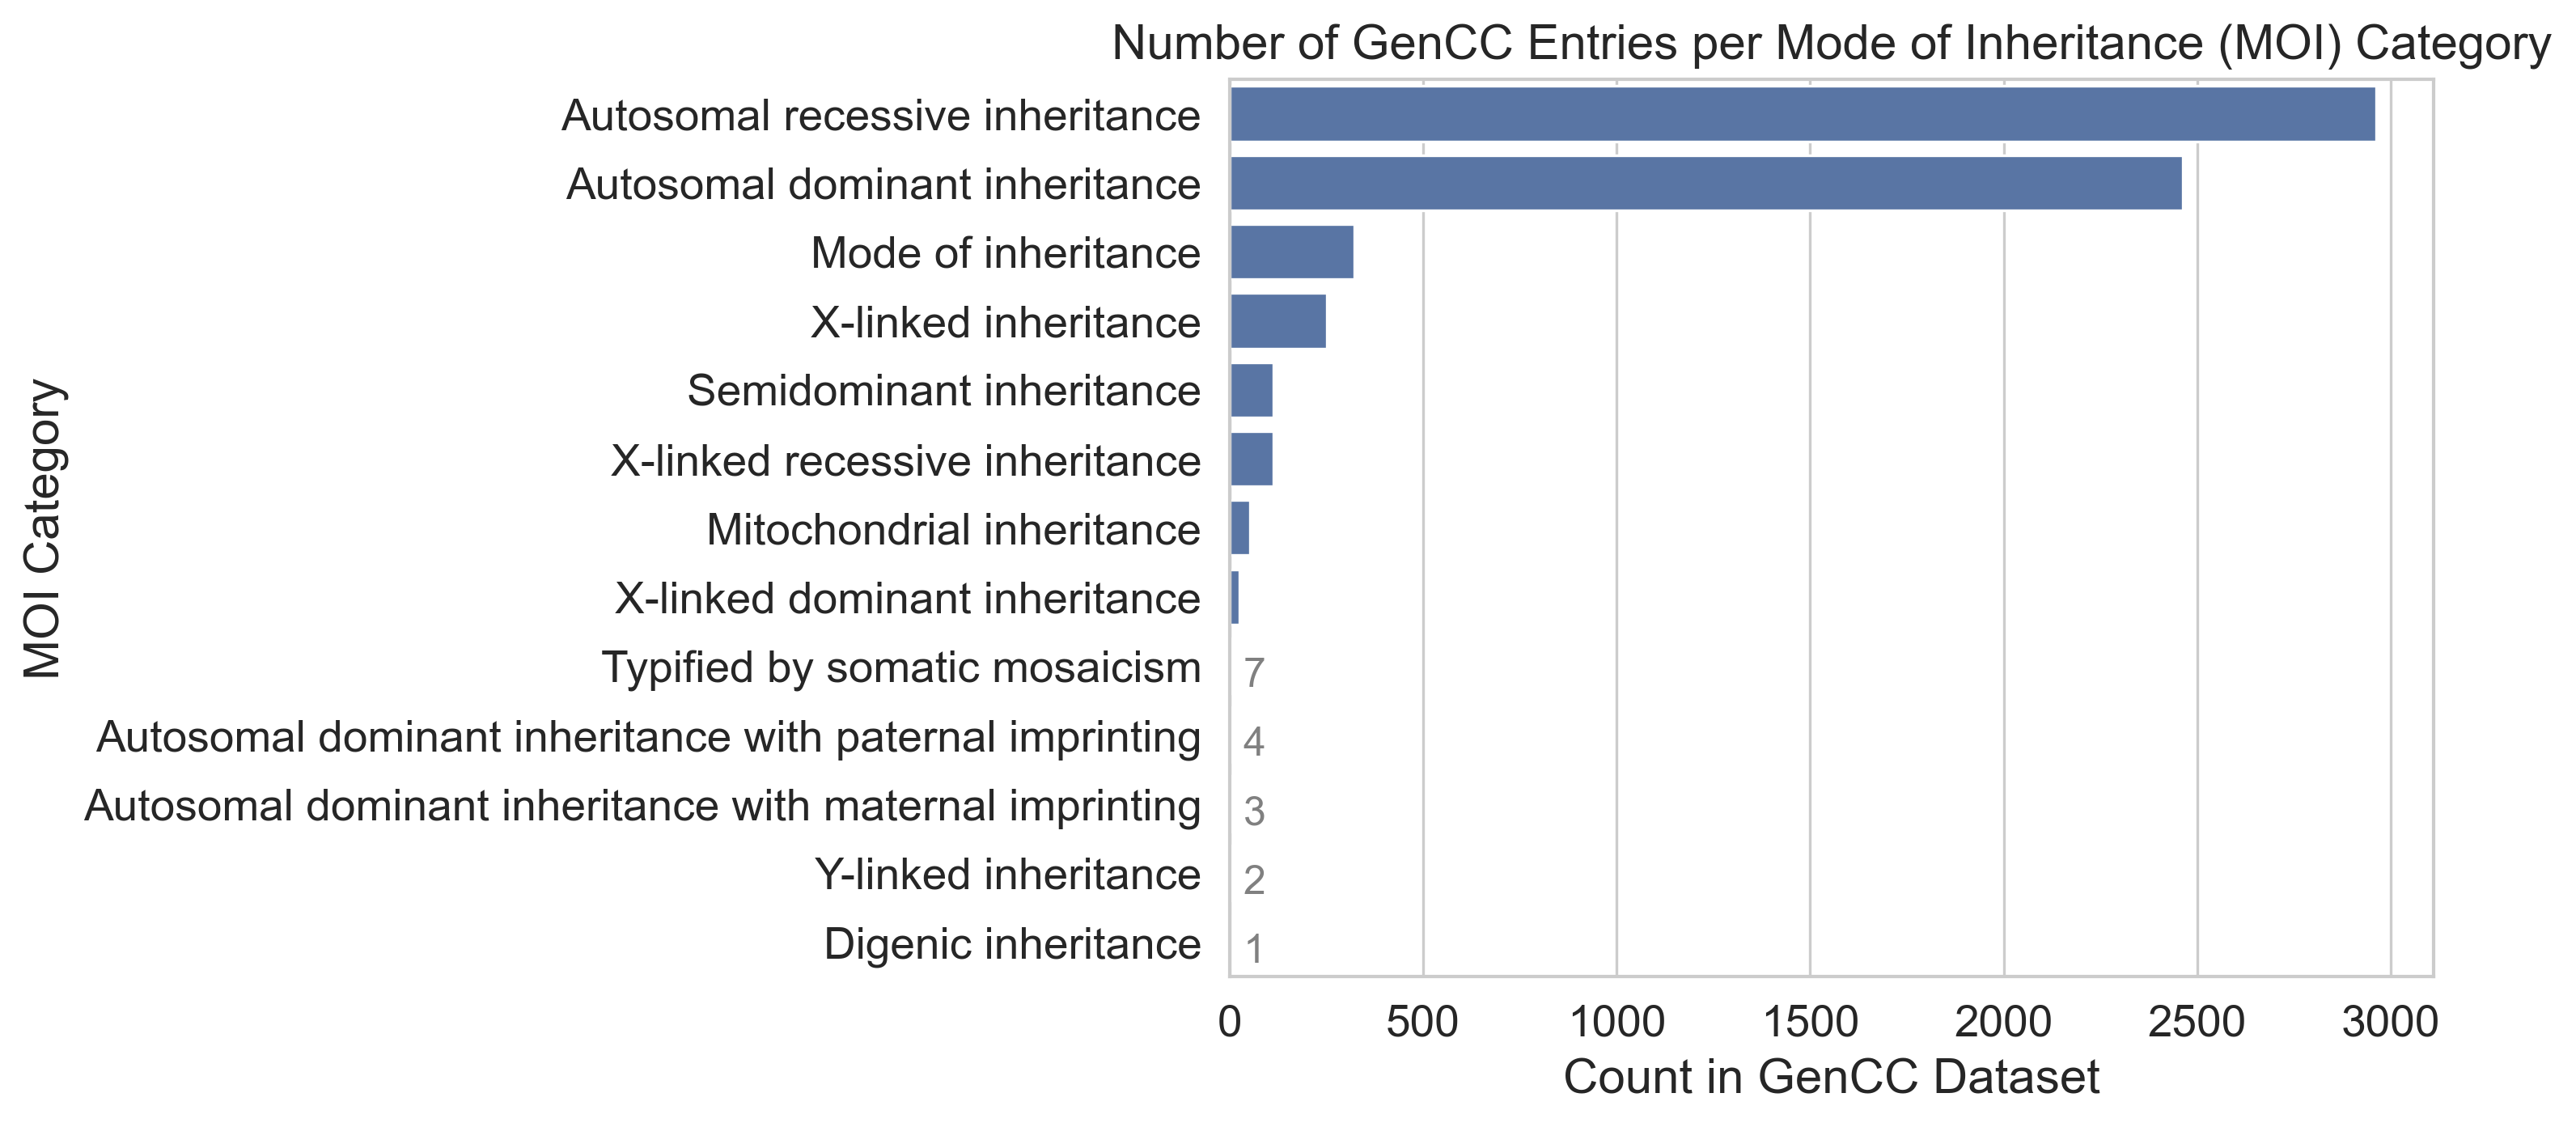
Autosomal dominant inheritance and autosomal recessive inheritance are the most common MOI (2464, 2963, respectively), with next most common category, mode of inheritance, being featured much less in the GenCC data (329 times). Autosomal dominant inheritance implies that only one altered gene copy is needed for a condition to to be inherited [8]. This significantly increases the likelihood of a child inheriting the condition if one parent carries it. Hence, such conditions are prevalent in the population.
Autosomal recessive conditions needs both copies of the gene to be mutated for the condition to manifest in a child. The higher count of recessive conditions in Figure 5 could stem from their increased severity, motivating more extensive research and consequently more associated gene data being analysed and discovered.
Regarding the scarcity of other categories like Y-linked inheritance, this could be explained with their rarity in the population. These MOIs are less common, reducing the occurrence of gene mutations associated with these inheritance patterns.
4.3 Part Three – Disease Groupings and Their Associated Genes
For the next analysis we used the MONDO disease ontology [3] to select a specific subset of GenCC diseases and find their associated genes. Specifically, we investigated the nervous system disorder (MONDO:0005071; NSD). NSD features 5587 subclasses in the ontology, excluding the root node. The first 10 subclasses are listed in Table 5, showing that the ontology is structured in a hierarchical manner, with NSD being an umbrella term for more specific disease definitions. We repeated this analysis with digestive system disorder (1446 subclasses in total; Table 16 in Appendix; DSD).
| MONDO ID | MONDO Name |
|---|---|
| MONDO:0002320 | congenital nervous system disorder |
| MONDO:0002602 | central nervous system disorder |
| MONDO:0002977 | autoimmune disorder of the nervous system |
| MONDO:0003569 | cranial nerve neuropathy |
| MONDO:0003620 | peripheral nervous system disorder |
| MONDO:0004466 | neuronitis |
| MONDO:0004618 | diplegia of upper limb |
| MONDO:0005283 | retinal disorder |
| MONDO:0005287 | developmental disability |
| MONDO:0005391 | restless legs syndrome |
The top subclasses in the NSD category include various specific conditions, including autoimmune, developmental, and localised neuropathies, reflecting a spectrum from broad neurological issues to specific anatomical or functional disruptions. For DSD, the subclasses largely focus on organ-specific diseases such as neoplasms, autoimmune problems, and localised issues like peptic ulcers, demonstrating a more concentrated emphasis on the digestive tract.
| MONDO ID | Disease Name | Gene Count |
|---|---|---|
| MONDO:0100038 | complex neurodevelopmental disorder | 149 |
| MONDO:0009723 | Leigh syndrome | 113 |
| MONDO:0019200 | retinitis pigmentosa | 90 |
| MONDO:0005090 | schizophrenia | 88 |
| MONDO:0019497 | nonsyndromic genetic hearing loss | 85 |
| MONDO:0007661 | Tourette syndrome | 76 |
| MONDO:0019588 | hearing loss, autosomal recessive | 72 |
| MONDO:0000508 | syndromic intellectual disability | 66 |
| MONDO:0001071 | intellectual disability | 49 |
| MONDO:0100062 | developmental and epileptic encephalopathy | 45 |
NSDs like complex neurodevelopmental disorder and Leigh syndrome exhibit a notably higher gene count in the GenCC data, suggesting a larger number of genetic factors involved in these disorders. DSDs such as hereditary nonpolyposis colon cancer and permanent neonatal diabetes mellitus have fewer associated genes, suggesting a comparatively more focused genetic involvement in these conditions. This is further illustrated in Table 6 (Table 17 for DSD).
Indeed, comparing the total number of genes associated with the disorders in the GenCC data, we see that diseases associated with NSD have a higher total gene count (2211) than DSD (217). Table 7 presents the top 10 genes by number of entries for the GenCC data filtered for NSD and DSD.
| Gene | Number of restricted GenCC entries |
|---|---|
| SCN4A | 17 |
| MECP2 | 16 |
| SCN1A | 15 |
| POMGNT1 | 15 |
| COL6A3 | 15 |
| TTN | 15 |
| ARX | 15 |
| PLP1 | 14 |
| MYO7A | 14 |
| CACNA1A | 14 |
| Gene | Number of restricted GenCC entries |
|---|---|
| KCNJ11 | 17 |
| ABCC8 | 15 |
| EPCAM | 11 |
| GCK | 11 |
| INS | 10 |
| GUCY2C | 9 |
| MLH1 | 9 |
| MSH6 | 8 |
| HNF4A | 8 |
| MSH2 | 8 |
4.4 Part Four – Building a Simple GenCC Disease Network
This part of the project focused on building a simple network of diseases falling under the NSD category, and of their associated genes. Table 8 a) presents the top 10 disease pairs with the highest shared genes counts. The top pair, nonsyndromic genetic hearing loss (NGHL) and hearing loss, autosomal recessive (HLAR), share 59 genes. This is not surprising as NGHL, a subtype of hearing loss without additional medical issues or symptoms, can also be inherited in an autosomal recessive manner [9].
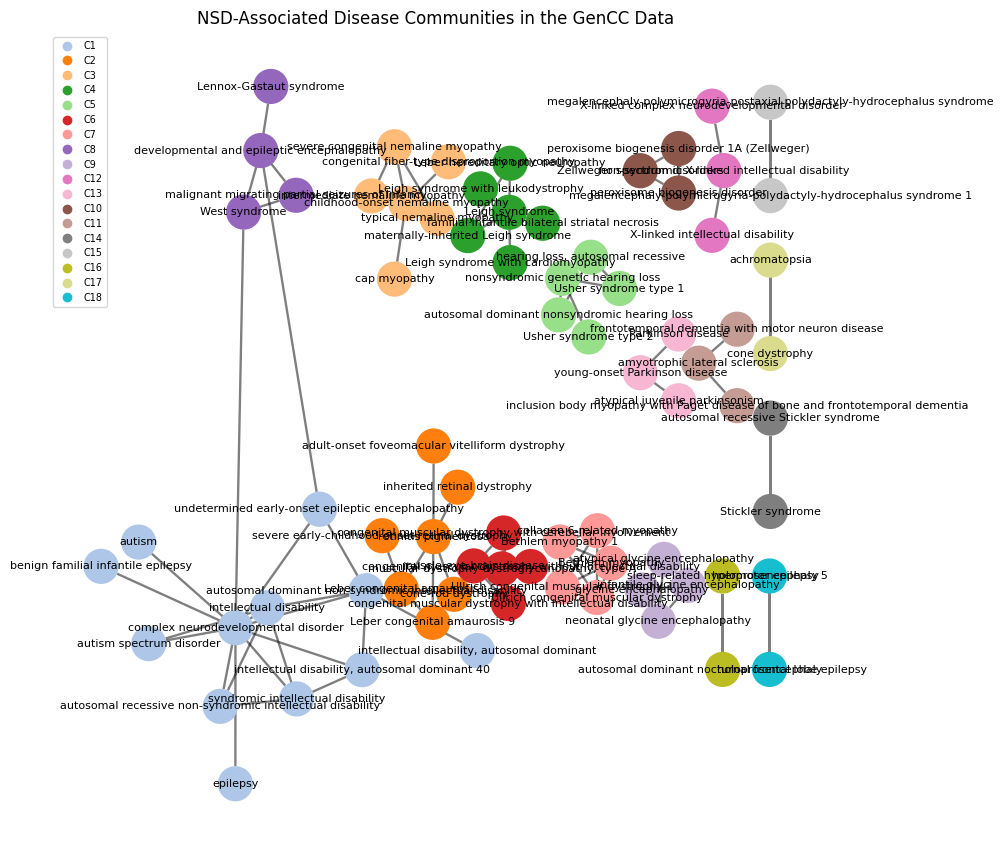
Table 8 b) shows the communities of diseases identified in the network built from the results of the previous analysis, only adding disease pairs with three or more common genes to the network. The network is visualised in Figure 6, featuring 18 communities, with the largest community C1 containing 12 nodes. 93 edges connect 76 nodes; the network is not fully connected so that most communities are isolated from each other.
Within a community, nodes are generally highly connected, indicating a high number of shared genes between community-specific diseases. For instance, having a closer look at how diseases are related within the largest community C1 (Table 18), the common factor among these disorder seems involve intellectual disability. This implicates shared pathways related to genetic links or disruptions in brain functions, caused by a highly overlapping set of genes.
| Disease Pair | Gene_Count |
|---|---|
| MONDO:0019588,MONDO:0019497 | 54 |
| MONDO:0019587,MONDO:0019497 | 29 |
| MONDO:0009723,MONDO:0016815 | 28 |
| MONDO:0019609,MONDO:0019234 | 13 |
| MONDO:0019587,MONDO:0019588 | 11 |
| MONDO:0100038,MONDO:0015802 | 11 |
| MONDO:0000508,MONDO:0014699 | 10 |
| MONDO:0000508,MONDO:0100038 | 10 |
| MONDO:0019200,MONDO:0018998 | 9 |
| MONDO:0019200,MONDO:0015993 | 8 |
| Community Number | Number of Diseases |
|---|---|
| C1 | 12 |
| C2 | 7 |
| C3 | 6 |
| C4 | 6 |
| C5 | 5 |
| C6 | 5 |
| C7 | 5 |
| C8 | 4 |
| C9 | 4 |
| C12 | 3 |
| C13 | 3 |
| C10 | 3 |
| C11 | 3 |
| C14 | 2 |
| C15 | 2 |
| C16 | 2 |
| C17 | 2 |
| C18 | 2 |
5 Discussion
This project looked into the GenCC database, exploring gene-disease mappings and leveraging support from the MONDO disease ontology and Human phenotype ontology. We found that the majority of diseases are linked to a limited number of genes, with a trimmed mean average of 1.67 genes per disease. The validity of the data is predominantly supported by strong, or definite, supportive evidence. Most entries lacked an associated PMID or DOI as assertion URL. The temporal analysis revealed spikes in data submissions in 2020 and 2021, with the latter surge attributed to the submission of rare disease gene evidence by Orphanet and the former likely associated with the official database launch.
The investigation into Modes of Inheritance (MOIs) confirmed that autosomal dominant and autosomal recessive patterns were the most prevalent, aligning with their high occurrence in the population. Utilising the MONDO disease ontology, we compared NSD and DSD, finding that NSD exhibited a significantly higher number of subclasses and associated genes than DSD. This discrepancy suggested a more concentrated genetic involvement in the subclassed conditions of DSD, potentially indicating a more organ-specific focus for DSD compared to the broader implications of NSDs.
A network focusing on NSD diseases and their associated genes was clustered into 18 distinct communities, with the largest community centering around intellectual disability. This community highlighted shared pathways related to genetic links or disruptions in brain functions.
There are several opportunities for future work. First, investigation into URLs falling into the Other assertion_criteria_url category could yield further provenance information to support the entry to ascertain that the provided evidence categories are accurate. Further research could compare the locations of disease-specific genes within and between clusters of the network to gain insight into which shared genes between diseases have what effect in the overall picture of NSD.
References
[1]
M. T. DiStefano et al., “The Gene Curation Coalition: A global effort to harmonize genedisease evidence resources,” Genetics in Medicine, vol. 24, no. 8, pp. 1732–1742, Aug. 2022.
[2]
S. Köhler et al., “The Human Phenotype Ontology in 2021,” Nucleic Acids Research, vol. 49, no. D1, pp. D1207–D1217, Jan. 2021.
[3]
N. A. Vasilevsky et al., “Mondo: Unifying diseases for the world, by the world,” Health Informatics, Preprint, Apr. 2022.
[4]
A. Clauset, M. E. J. Newman, and C. Moore, “Finding community structure in very large networks,” Physical Review E, vol. 70, no. 6, p. 066111, Dec. 2004.
[5]
“Orphanet submitter information and submissions.” https://search.thegencc.org/submitters/GENCC_000110, Nov-23AD.
[6]
“Gene Curation Coalition Launches GenCC Database - ClinGen | Clinical Genome Resource.” https://clinicalgenome.org/docs/gencc/, Dec-2020.
[7]
G. Alliance and T. N. Y.-M.-A. C. for G. and N. Screening Services, “INHERITANCE PATTERNS,” in Understanding Genetics: A New York, Mid-Atlantic Guide for Patients and Health Professionals, Genetic Alliance, 2009.
[8]
R. G. Lewis and B. Simpson, “Genetics, Autosomal Dominant,” in StatPearls, Treasure Island (FL): StatPearls Publishing, 2023.
[9]
A. E. Shearer, M. S. Hildebrand, A. M. Schaefer, and R. J. Smith, “Genetic Hearing Loss Overview,” in GeneReviews, M. P. Adam, J. Feldman, G. M. Mirzaa, R. A. Pagon, S. E. Wallace, L. J. Bean, K. W. Gripp, and A. Amemiya, Eds. Seattle (WA): University of Washington, Seattle, 1993.
[10]
W. McKinney, “Pandas: Powerful Python data analysis toolkit,” 2021.
[11]
E. Bisong, “Matplotlib and Seaborn,” in Building Machine Learning and Deep Learning Models on Google Cloud Platform, Berkeley, CA: Apress, 2019, pp. 151–165.
[12]
M. Larralde et al., “Althonos/pronto: V2.5.5.” Zenodo, Aug-2023.
[13]
A. Hagberg, D. Schult, P. Swart, and J. M. Hagberg, “Exploring Network Structure, Dynamics, and Function using NetworkX,” 2008.
[14]
P. J. N. Brodersen, “Netgraph: Publication-quality Network Visualisations inPython,” Journal of Open Source Software, vol. 8, no. 87, p. 5372, Jul. 2023.
[15]
J. J. Allaire, C. Teague, C. Scheidegger, Y. Xie, and C. Dervieux, “Quarto.” Jan-2022.
[16]
S. Eustace and The Poetry contributors, “Poetry: Python packaging and dependency management made easy.” Nov-2023.
Appendix
| Library/Tool | Description | Used for Part |
|---|---|---|
| Pandas [10] | Data analysis library for Python | P1,P2,P3,P4 |
| Matplotlib [11] | Data visualisation library for Python | P1,P2,P3,P4 |
| Seaborn [11] | Data visualisation library for Python | P1,P2,P3,P4 |
| Pronto [12] | Python library for working with ontologies | P2,P3 |
| NetworkX [13] | Python library for network analysis | P4 |
| netgraph [14] | Python library for network visualisation | P4 |
| Quarto [15] | Document authoring tool | P1,P2,P3,P4 |
| Poetry [16] | Python dependency management tool | P1,P2,P3,P4 |
| Number | UUID |
|---|---|
| 1 | GENCC_000112-HGNC_15516-OMIM_615777-HP_0000007-GENCC_100002 |
| 2 | GENCC_000107-HGNC_28883-OMIM_617222-HP_0000007-GENCC_100002 |
| 3 | GENCC_000114-HGNC_20074-MONDO_0015159 -HP_0000007-GENCC_100001 |
| 4 | GENCC_000101-HGNC_9588-OMIM_605309-HP_0000006-GENCC_100002 |
| uuid | gene_curie | gene_symbol | disease_curie | submitted_as_classification_id | |
|---|---|---|---|---|---|
| count | 18504 | 18504 | 18504 | 18394 | 18504 |
| unique | 18503 | 4888 | 4888 | 6370 | 9 |
| top | ommitted | HGNC:2200 | COL2A1 | MONDO:0100038 | GENCC:100009 |
| freq | 2 | 44 | 44 | 159 | 5330 |
| moi_curie | submitted_as_classification_name | submitted_as_date | submitted_as_assertion_criteria_url | |
|---|---|---|---|---|
| count | 18504 | 16372 | 18504 | 17256 |
| unique | 13 | 18 | 6904 | 989 |
| top | HP:0000007 | Supportive | 2021-09-14 00:00:00 | omitted |
| freq | 9122 | 5330 | 5330 | 5330 |
| self | other | |
|---|---|---|
| submitted_as_moi_name | nan | Autosomal recessive inheritance |
| submitted_as_submitter_name | TGMI G2P | nan |
| submitted_as_classification_name | nan | Strong |
| submitted_as_date | 2019-03-27 00:00:00 | 2019-03-27 22:15:19 |
| submitted_as_submission_id | 1000115516 | 2173 |
| submitted_run_date | 2023-09-11 | 2020-11-25 |
| Statistic | Value |
|---|---|
| Median | 1.00 |
| Trimmed Mean@^10 | 1.67 |
| Standard Deviation | 4.47 |
| MONDO ID | MONDO Name |
|---|---|
| MONDO:0000385 | benign digestive system neoplasm |
| MONDO:0000588 | autoimmune disorder of gastrointestinal tract |
| MONDO:0000888 | gastrointestinal mucositis |
| MONDO:0001673 | diarrheal disease |
| MONDO:0002356 | pancreas disorder |
| MONDO:0002515 | hepatobiliary disorder |
| MONDO:0002516 | digestive system cancer |
| MONDO:0003749 | esophageal disorder |
| MONDO:0004247 | peptic ulcer disease |
| MONDO:0004298 | stomach disorder |
| MONDO ID | Disease Name | Gene Count |
|---|---|---|
| MONDO:0018630 | hereditary nonpolyposis colon cancer | 17 |
| MONDO:0018911 | maturity-onset diabetes of the young | 13 |
| MONDO:0015967 | monogenic diabetes | 12 |
| MONDO:0100164 | permanent neonatal diabetes mellitus | 12 |
| MONDO:0016391 | neonatal diabetes mellitus | 10 |
| MONDO:0005575 | colorectal cancer | 10 |
| MONDO:0020525 | transient neonatal diabetes mellitus | 9 |
| MONDO:0009831 | malignant pancreatic neoplasm | 8 |
| MONDO:0005835 | Lynch syndrome | 7 |
| MONDO:0018309 | Hirschsprung disease | 7 |
| ID | Name |
|---|---|
| MONDO:0000508 | syndromic intellectual disability |
| MONDO:0018614 | undetermined early-onset epileptic encephalopathy |
| MONDO:0014699 | intellectual disability, autosomal dominant 40 |
| MONDO:0005027 | epilepsy |
| MONDO:0005260 | autism |
| MONDO:0015802 | autosomal dominant non-syndromic intellectual disability |
| MONDO:0100172 | intellectual disability, autosomal dominant |
| MONDO:0100038 | complex neurodevelopmental disorder |
| MONDO:0001071 | intellectual disability |
| MONDO:0005258 | autism spectrum disorder |
| MONDO:0019502 | autosomal recessive non-syndromic intellectual disability |
| MONDO:0017615 | benign familial infantile epilepsy |
[tool.poetry]
name = "pf-gene-disease-mapping-exploration"
version = "0.1.0"
description = ""
authors = []
readme = "README.md"

[tool.poetry.dependencies]
python = ">=3.11,<3.13"
pandas = "^2.1.2"
seaborn = "^0.13.0"
jupyter = "^1.0.0"
matplotlib = "^3.8.1"
tabulate = "^0.9.0"
pronto = "^2.5.5"
rich = "^13.6.0"
networkx = "^3.2.1"
netgraph = "^4.12.11"
jupyter-cache = "^1.0.0"


[build-system]
requires = ["poetry-core"]
build-backend = "poetry.core.masonry.api"
Footnotes
For the PMID, we did not require a strict
PMID:IDformat but also allowed thehttps://pubmed.ncbi.nlm.nih.gov/<PMID>format.↩︎